Motion Lab Done 3 Ways - 9/14/2018
Lab Partners: Charles Stuart, Dylan Torrey
Research Question: How does the position of a motorized buggy change over time?
Lab Partners: Charles Stuart, Dylan Torrey
Research Question: How does the position of a motorized buggy change over time?
The independent variable was the time since the buggy started moving and the position of the buggy was the dependent variable. To minimize the effect of any other variables, we ensured that the buggy travelled the same length of table in the same direction to take into account any tilt in the table. We also used the same buggy for each test and minimized excessive use to preserve is battery. While we were unable to start the buggy from the same point on the table due to our three different methods of collecting data, we factored this in to our measurements, making the initial position of the buggy position 0 when possible.
To collect the data for this lab, we used three different methods: a stopwatch, motion sensor, and Logger Pro’s video analysis tools. For the stopwatch method we used an iPhone to record the position of the buggy at specific times, starting at 0.5 seconds and increasing to 5.5 seconds in 1 second increments. One group member would start the buggy, and when it reached the 0 cm mark on a yardstick running parallel to the path of the buggy, another group member would start the timer. Once the timer reached the desired time, he would call out and another member would note the position of the buggy, recording it in their lab notebook. Because this method had a significant amount of uncertainty due to human reaction time, the position at each time was measured three times. These trials were averaged to form data points.
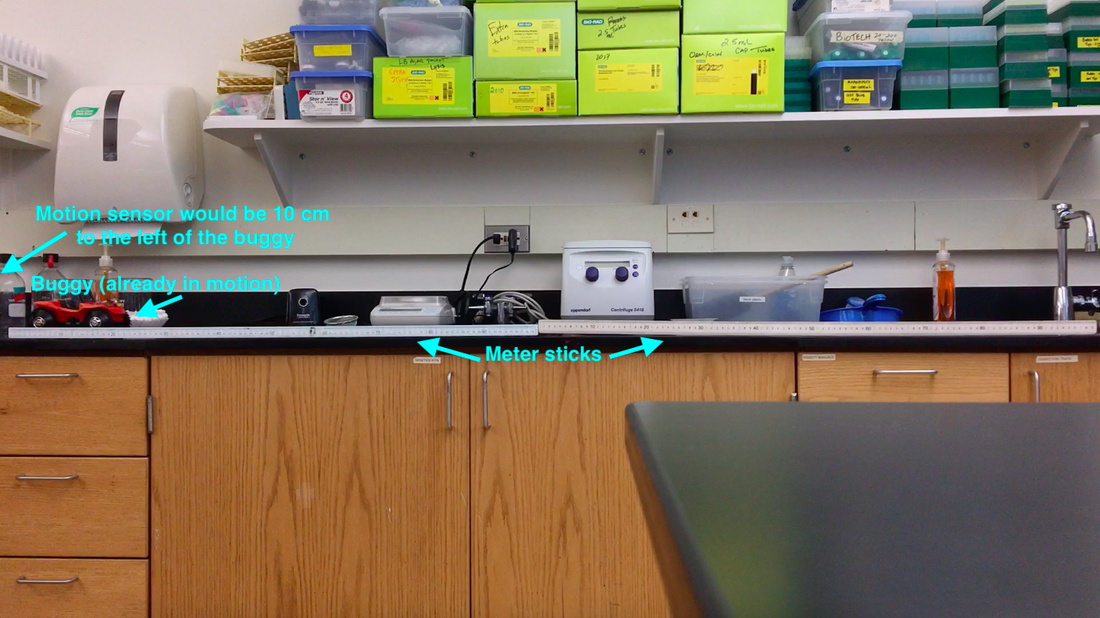
For the video analysis, we set up an iPhone so its camera captured the entire path of the rover, along with two meter sticks in the slight foreground for scale. After recording the buggy travel across the table, we inserted the video into Logger Pro and used the software’s video analysis tool to plot the buggy’s location on the screen over the course of the video. We created a total of 10 data points relating a point on the front of the buggy to the amount of time elapsed in the video.
For the motion sensor, we connected a sensor which measures the distance of an object in meters from itself to one of our computers. We then let the buggy travel away from the sensor as it recorded the data into Logger Pro, automatically generating a position vs. time graph. One quirk of the motion sensor is that it has a minimum distance of 10 cm, so we moved the sensor back 10 cm behind the 0 cm mark on the ruler plus the length of the buggy, so that it was 10cm behind the buggy when it was in its initial position. This resulted in a higher Y-intercept on the graph. The motion sensor also recorded 100 data points over the 5 seconds it took for the buggy to travel the length of the meter sticks, so the data table for the motion sensor only includes the first second of data.
To collect the data for this lab, we used three different methods: a stopwatch, motion sensor, and Logger Pro’s video analysis tools. For the stopwatch method we used an iPhone to record the position of the buggy at specific times, starting at 0.5 seconds and increasing to 5.5 seconds in 1 second increments. One group member would start the buggy, and when it reached the 0 cm mark on a yardstick running parallel to the path of the buggy, another group member would start the timer. Once the timer reached the desired time, he would call out and another member would note the position of the buggy, recording it in their lab notebook. Because this method had a significant amount of uncertainty due to human reaction time, the position at each time was measured three times. These trials were averaged to form data points.
For the video analysis, we set up an iPhone so its camera captured the entire path of the rover, along with two meter sticks in the slight foreground for scale. After recording the buggy travel across the table, we inserted the video into Logger Pro and used the software’s video analysis tool to plot the buggy’s location on the screen over the course of the video. We created a total of 10 data points relating a point on the front of the buggy to the amount of time elapsed in the video.
For the motion sensor, we connected a sensor which measures the distance of an object in meters from itself to one of our computers. We then let the buggy travel away from the sensor as it recorded the data into Logger Pro, automatically generating a position vs. time graph. One quirk of the motion sensor is that it has a minimum distance of 10 cm, so we moved the sensor back 10 cm behind the 0 cm mark on the ruler plus the length of the buggy, so that it was 10cm behind the buggy when it was in its initial position. This resulted in a higher Y-intercept on the graph. The motion sensor also recorded 100 data points over the 5 seconds it took for the buggy to travel the length of the meter sticks, so the data table for the motion sensor only includes the first second of data.
For each method of collecting data, a linear fit matched each set of data well. A linear fit in this scenario would mean that the cart moved at a constant velocity, or a constant number of centimeters per second. The slope represents this velocity, and the average slope across all of the methods was 21.7 cm/s with an uncertainty of +/- 3.05 cm/s. While the buggy's initial position should be 0 cm, only the stopwatch method produced a Y intercept which was relatively close to 0cm. Because the motion sensor has a minimum distance of about 10 cm, the Y intercept is 15.7 cm, as that is the distance from the center at which we first placed the buggy. The video analysis also has an increased Y-intercept of 4.52 cm, as the video begins with the buggy sticking out from the extreme left of the shot, which Logger Pro considers position 0.
Each of the three methods of data collection had their strengths and weaknesses. For example, the motion sensor collects 100 data points in 5 second, which would be nearly impossible to accomplish when using a stopwatch and unreasonably time-consuming when using Logger Pro's video analysis. The disadvantage of the motion sensor was its minimum measuring distance of 10 cm, which skewed the Y-intercept value. In contrast, the stopwatch recorded the Y-intercept with better accuracy because the timer could start the timer at the exact instant that the buggy reached the 0 cm mark on the meter stick. However, we recorded the least amount of data points with the stopwatch method and human reaction time could have heavily skewed the results. The video analysis yielded a good number of data points, but this method could be influenced parallax, as the camera remains in one spot while the car moves across its field of view.
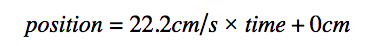
Overall, the motion sensor is the most useful method of collecting data for this constant velocity model because of the sheer number of data points it produces in a mere 5 seconds of testing. While the Y-intercept was not accurate, because the buggy follows a constant velocity model and has a known initial position of 0 cm, we can tweak the equation by manually inputing a Y-intercept of 0 cm with the recorded slope:
Each of the three methods of data collection had their strengths and weaknesses. For example, the motion sensor collects 100 data points in 5 second, which would be nearly impossible to accomplish when using a stopwatch and unreasonably time-consuming when using Logger Pro's video analysis. The disadvantage of the motion sensor was its minimum measuring distance of 10 cm, which skewed the Y-intercept value. In contrast, the stopwatch recorded the Y-intercept with better accuracy because the timer could start the timer at the exact instant that the buggy reached the 0 cm mark on the meter stick. However, we recorded the least amount of data points with the stopwatch method and human reaction time could have heavily skewed the results. The video analysis yielded a good number of data points, but this method could be influenced parallax, as the camera remains in one spot while the car moves across its field of view.
Overall, the motion sensor is the most useful method of collecting data for this constant velocity model because of the sheer number of data points it produces in a mere 5 seconds of testing. While the Y-intercept was not accurate, because the buggy follows a constant velocity model and has a known initial position of 0 cm, we can tweak the equation by manually inputing a Y-intercept of 0 cm with the recorded slope:
To improve this method, the sensor could have a small 10 cm ruler attached which would mark the minimum distance from the sensor. Ideally, the sensor would also consider this point to be position 0 so the data and graph would not be skewed.
