To test if impulse (J) is the average force over a period of time, if it can be represented by the area of a force vs. time graph, and if impulse is a change in momentum, we set up a near frictionless cart, a motion sensor, and a force sensor. We rolled the cart toward the force sensor and recorded the cart's motion and force it applied when hitting the sensor.
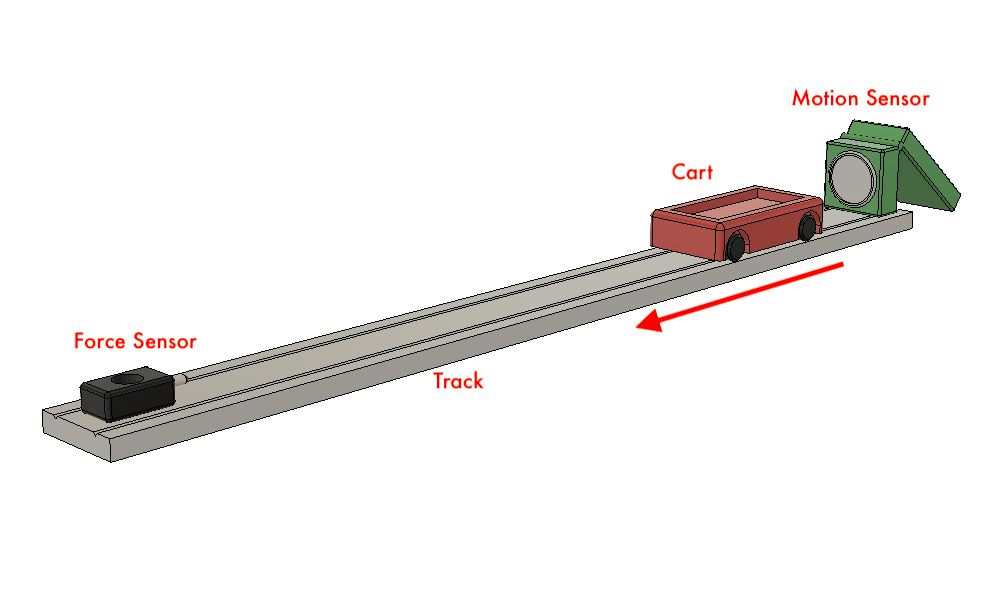
Lab Setup
Velocity (m/s) vs. Time (s)
Momentum (kg*m/s) vs. Time (s)
Momentum (kg*m/s) vs. Time (s)
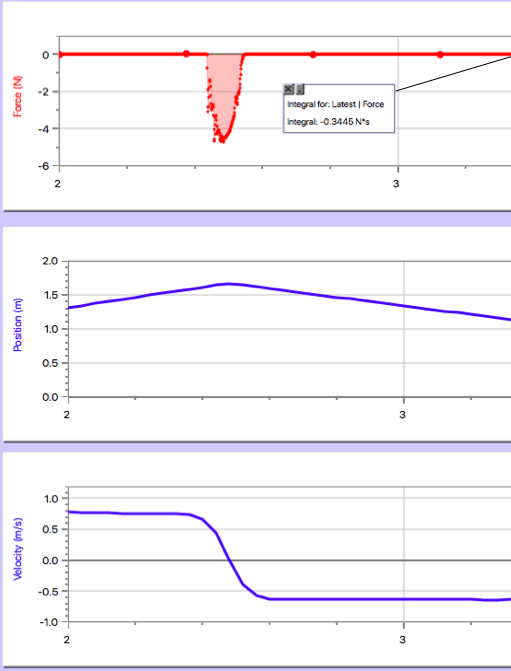
We first measured the momentum of the cart before and after it bounced off of the force sensor. Momentum is the product of an object's mass and it's velocity. Because the mass of the cart was s constant 252 grams, the momentum-time graph is simply the object's velocity-time graph vertically scaled by its mass. The cart's initial velocity was 0.8m/s and its final velocity after bouncing off of the force sensor was -0.6m/s as it was rolling in the other direction.
Initial Momentum = 0.8m/s * 0.252kg = 0.202kg*m/s
Final Momentum = -0.6m/s * .252kg = -.0151kg*m/s
Final Momentum = -0.6m/s * .252kg = -.0151kg*m/s
If impulse is indeed a change in momentum, then the impulse on the cart would be represented by the difference between these momentums:
0.202kg*m/s - (-0.151)kg*m/s = -0.353N*s
This impulse is nearly identical to the area under the force sensor's force-time graph, -0.345N*s, suggesting that impulse is a change in momentum and that it can be represented by the area under a force-time graph. The values were only off by 2.4%, strongly suggesting a connection. Additionally, the average force across the 0.15 seconds the cart was in contact with the force sensor was -2.2N. Calculating the impulse as a product of these two values results in:
-2.2N * 0.15s = -0.33N*s
This value is only 6.5% off from the difference in the cart's momentum, strongly suggesting that an impulse also represents an average force over a period of time.
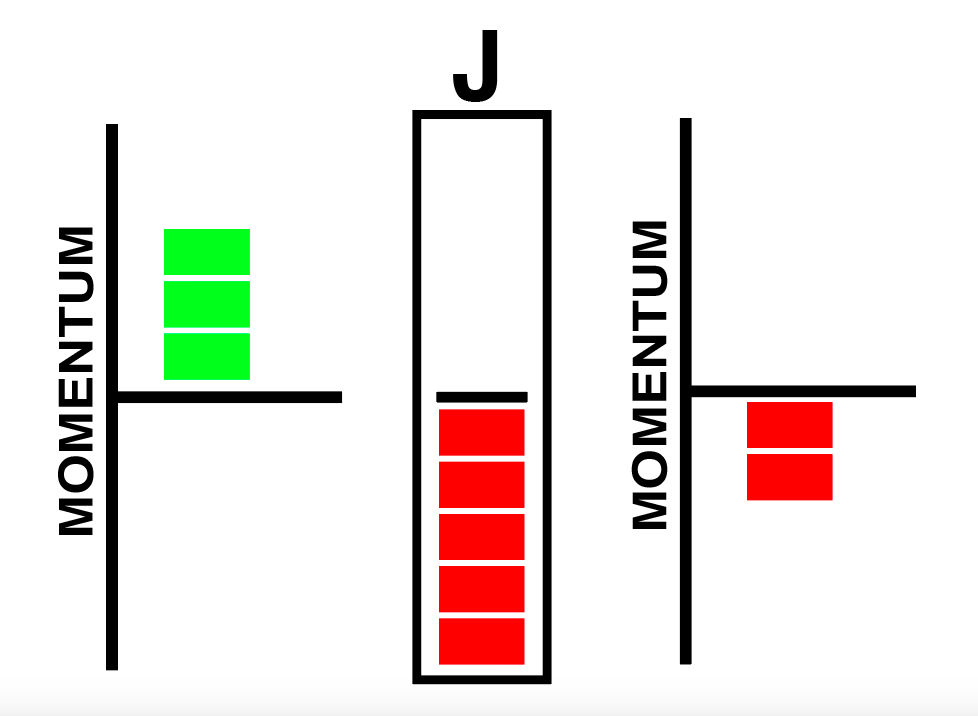
With impulse as a change in momentum, the system can be represented with a chart which qualitatively shows the cart's initial momentum, the impulse by the force sensor, and the final momentum of the car:
With impulse as a change in momentum, the system can be represented with a chart which qualitatively shows the cart's initial momentum, the impulse by the force sensor, and the final momentum of the car:
Widget is loading comments...
